


Start the PyMOL program and load the PDB structure 5chy. We picked this file because it does not contain missing atoms or multiple conformations. PyMOL allows retrieval of PDB files from the protein databank via the PDB Loader Service plugin. This is a 2.00 Angstrom structure of a mutant form of CheY in which the tyrosin at position 106 has been replaced by tryptophan. This mutation does not affect the overall structure and electrostatic potential of CheY. To create an electrostatic potential surface for this protein follow these steps
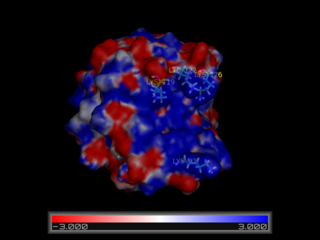
The molecule is rendered as a surface that is colored according to the electrostatic potential. As the color legend indicates, the red color (negative potential) arises from an excess of negative charges near the surface and the blue color (positive potential) occurs when the surface is positively charged. The white regions correspond to fairly neutral potentials. Alter the low and high range to -3 and +3, respectively to identify areas that have strong potentials (the suitable values depend on the number and distribution of charged groups in the molecule, and the pH you wish to carry out the analysis at). Rotate the structure with the mouse and examine the surface. Identify a large positively charged surface patch in this negatively charged protein. This region is a good candidate for the binding of negatively charged FliM and the P2 domain of CheA.
We will now increase the transparency of the surface such that the residues that contribute to the positive electrostatic potential can be identified. The transparency values range from 0 (non-transparent) to 1 (fully transparent). Type set transparency, 0.4 to make the surface 40% transparent. We suspect that the positive charge on the surface patch is created by positively charged side chains (Lys, Arg, or His) so we will render them in a more prominent fashion. Enter the following commands in bold in the PyMOL console:
The view we have created suggests that CheY has a large positively charged surface crevice and that residues Lys 92, Lys119, Lys122, Lys 126, and Arg 73 may be important for binding to negatively charged partners. This hypothesis is further backed up by the observation that these positions are highly conserved across a variety of bacterial CheY proteins. We will next analyze the structure of complexes of CheY with the kinase CheA in order to see if we have correctly located the binding surface.