


Computer-Aided Drug Design Tutorials: Visualization of Protein Surfaces with PyMOL
PyMOL for Molecular Visualization
We will be using PyMOL for visualizing macromolecules. According to the program's author, late Dr. Warren DeLano, PyMOL is a molecular graphics system with an embedded Python interpreter designed for real-time visualization and rapid generation of high-quality molecular graphics images and animations. It can also perform many other valuable tasks (such as editing PDB files) to assist you in your research.
The strengths of PyMOL arise from the emphasis on high-quality graphics, the use of the powerful programming language (Python), and the extendability with Plugins. Some of the plugins, such as ABPS for the calculation of electrostatic potentials in proteins, CAVER for identifying access routes to protein cavities, and LigAlign for atom-to-atom mapping of ligands in different structures are useful in structure-based drug design.
During the PyMOL development, emphasis has been on functionality and not on ease of use. As a result, a powerful functionality is available via PyMOL commands that one types into the PyMOL command line. But the menu-driven user interface is not particularly intuitive and it takes a little time to learn the program. The PyMOL commands are explained in the PyMOL manual and in PyMOL Wiki. Examples of PyMOL images, with commands used to generate these views, are available in the Biomolecular Images and Movies for Teaching page. In more difficult cases you can ask help from PyMOL users via PyMOL forum. PyMOL is available for many computer platforms, and students in the drug design course may install a precompiled educational versions (available from the course instructor) to their personal computers. As of early 2010, development of PyMOL is continued by Schrodinger, LLC.
You can interact with the program via four complimentary ways:
- Pull-down menus provide access to the file functions, the molecular editor, the program options, and a few more advanced tasks. For example, you can change the display quality settings, the background color, the size of your spheres, or the transparency of the surface from the pull-down menus. The Wizard menu guides you through some of the tasks that require a higher level of interactivity.
- A task bar on the right side of the screen allows one to select how to display selected objects. For example, you can show your protein as a grey surface and the inhibitor as green sticks if you have previously separated them into two different objects.
- The molecular display area allows to one view and interactively manipulate molecules. Your three-button mouse allows you to rotate, move, and zoom in/out by holding down the left, middle, or right button, respectively. Furthermore, you can select and perform specific tasks via mouse and keyboard shortcuts. For example, you can select two atoms (first by CTRL-SHIFT/left-clicking, second by CTRL-SHIFT/right-clicking ) and create a covalent bond by pressing CTRL-T.
- The command line allows you to type in commands that can accomplish almost any of PyMOL's functions. For example, you can create dashed lines (a good way to show hydrogen bonds) between oxygens and nearby amide hydrogens in the alpha-helix by using a command "dist (helix and name o), (helix and (name h and neighbor name n)), 2.5". This is the most powerful way to interact with the program, but requires that you are familiar with the logic and syntax of PyMOL commands.
Surface Representation of Proteins
As most drugs bind at the surface of the protein, it is a common task to visualize the protein surface in order to locate the binding pocket. This is a fairly trivial task if a structure of the protein-ligand complex is available from the PDB. Follow these instructions to quickly locate the substrate binding pocket in influenza neuraminidase.
- Open PyMOL by typing pymol.
- From Plugin, select PDB Loader Service, and enter 2HT8.
- Slowly rotate the molecule on the screen and try to see where the bound ligand is. It is rather hard to identify the ligand in this representation.
- Color is very useful for identifying ligands. Type color yellow, resn G39 to color the bound ligand in a distinct color. Visually locate the bound ligand in the structure.
- Create an object for your protein by typing into the PyMOL command line (either in the Tcl/Tk GUI, or in the Viewer), the following PyMOL command: create protein, chain A. If a protein has more than one chain, you should include all of them (e.g. create protein, chain A and chain B and chain C). Notice that an object "protein" was added to the right-hand task bar.
- Create an object for your ligand by typing create ligand, resn G39. The program will automatically zoom into the ligand. Zoom out by holding the right mouse button while dragging up. If needed, adjust the cut plane with the mouse button that is tied to the Slab function, or select Clip -> Nothing from the Display menu.
- Color your protein object in your favourite color. For example, to color the protein in a peaceful light wheat color, type color wheat, protein. Notice that not much changed because the original object (2HT8) is still shown by atom colors. To hide this object, click H for Hide, then everything for the 2HT8 row in the right-hand task-bar.
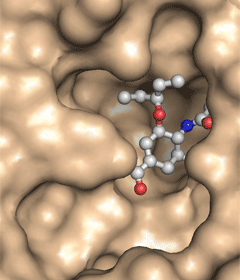
- Show the surface of the protein (type show surface, protein)
- Examine the binding pocket. Does the drug fill all of the pocket? Could the pocket possibly accommodate a longer ether side chain?
- Change the representation of the ligand to stick representation by typing show sticks, ligand
- Modify the representation of the ligand to CPK representation by typing show spheres, ligand
- Reduce the scale of the spheres by typing set sphere_scale, 0.33. You now have "ball-and-stick" model of the ligand.
- You have lots of control over many parameters that control the visual representation of the structure in PyMOL. For example, you could pick one of the many coloring schemes for the ligand from the Color: menu in the right-hand task-bar. And you can change the transparency of the surface such that you could see the amino acids that interact with the ligand. For example, a command set transparency, 0.3 will make the surface 30% transparent.
- Save a picture of the view on the screen using Save Image under File menu.
- You may want to examine this structure in 3D stereo mode by visiting the one of the workstations that is equipped with stereo graphics.
- The monochrome surface view is good for examining the steric requirements for binding but hides the underlying chemical nature of the active site. The next part of this tutorial illustrates how to perform a more detailed analysis of the binding pocket.