B1-X1-E


B1-X1-No


B1-Y1-No


B1-Y2-F

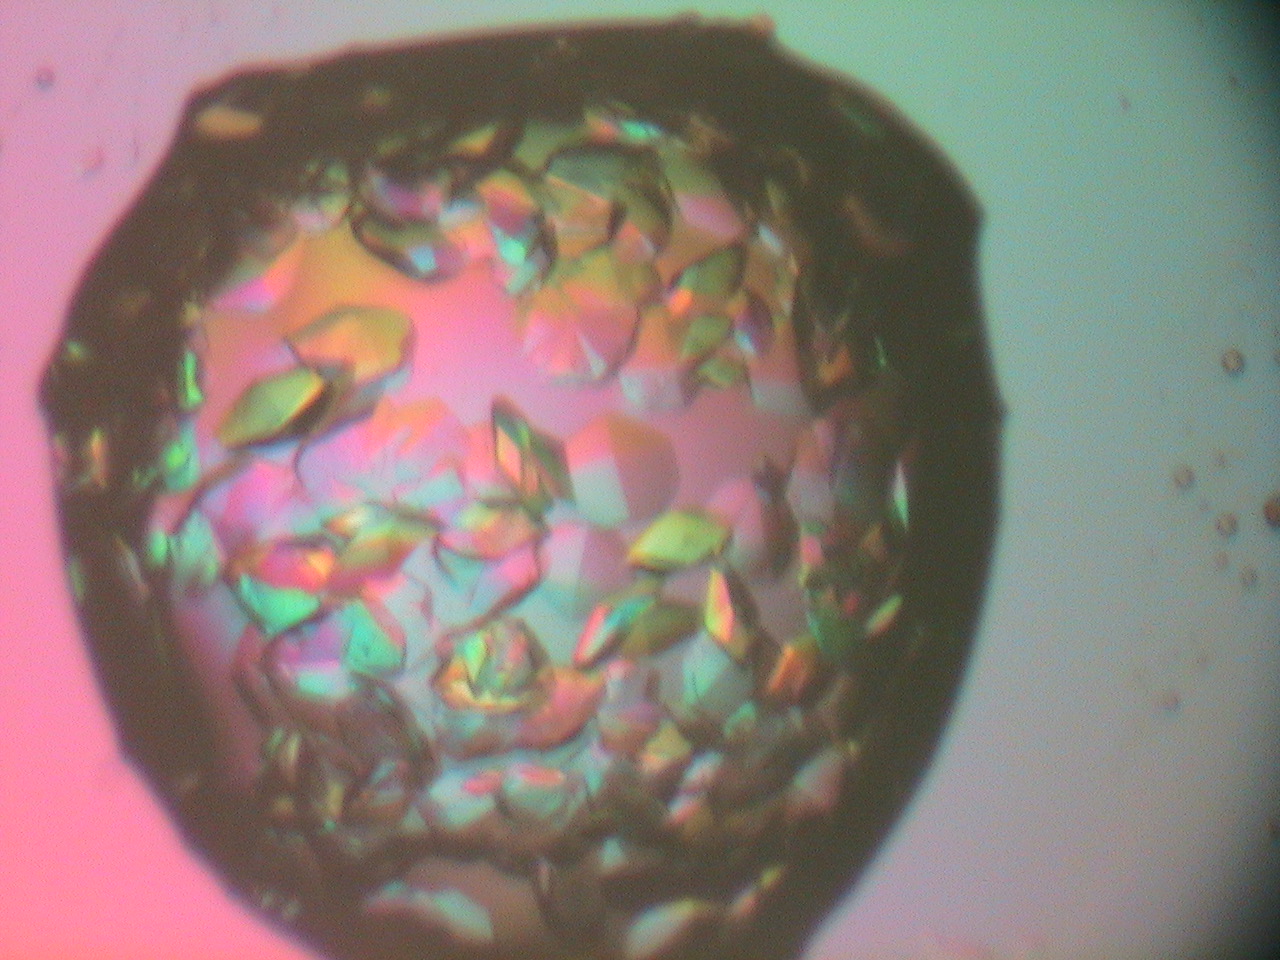
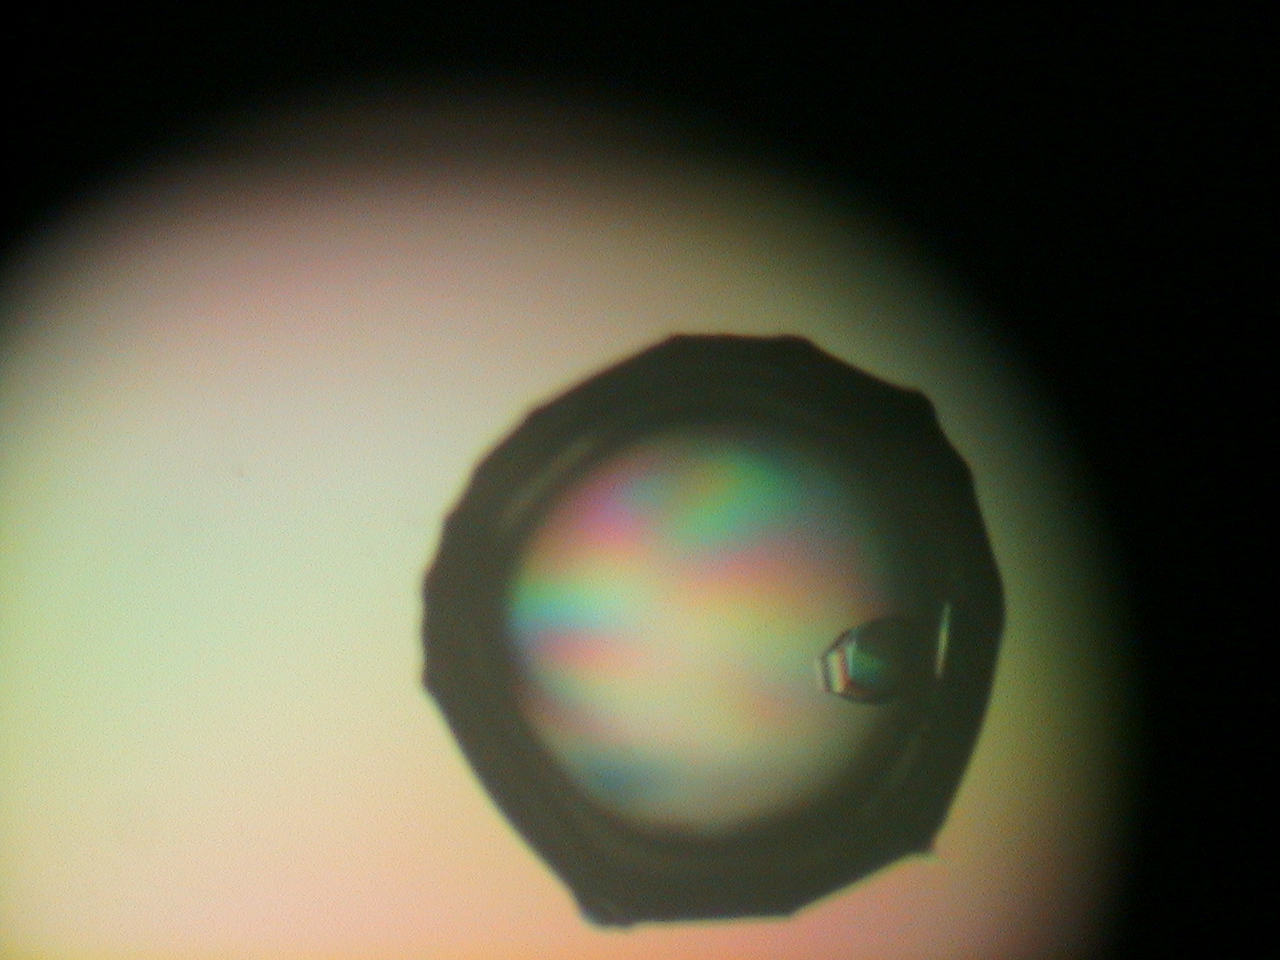
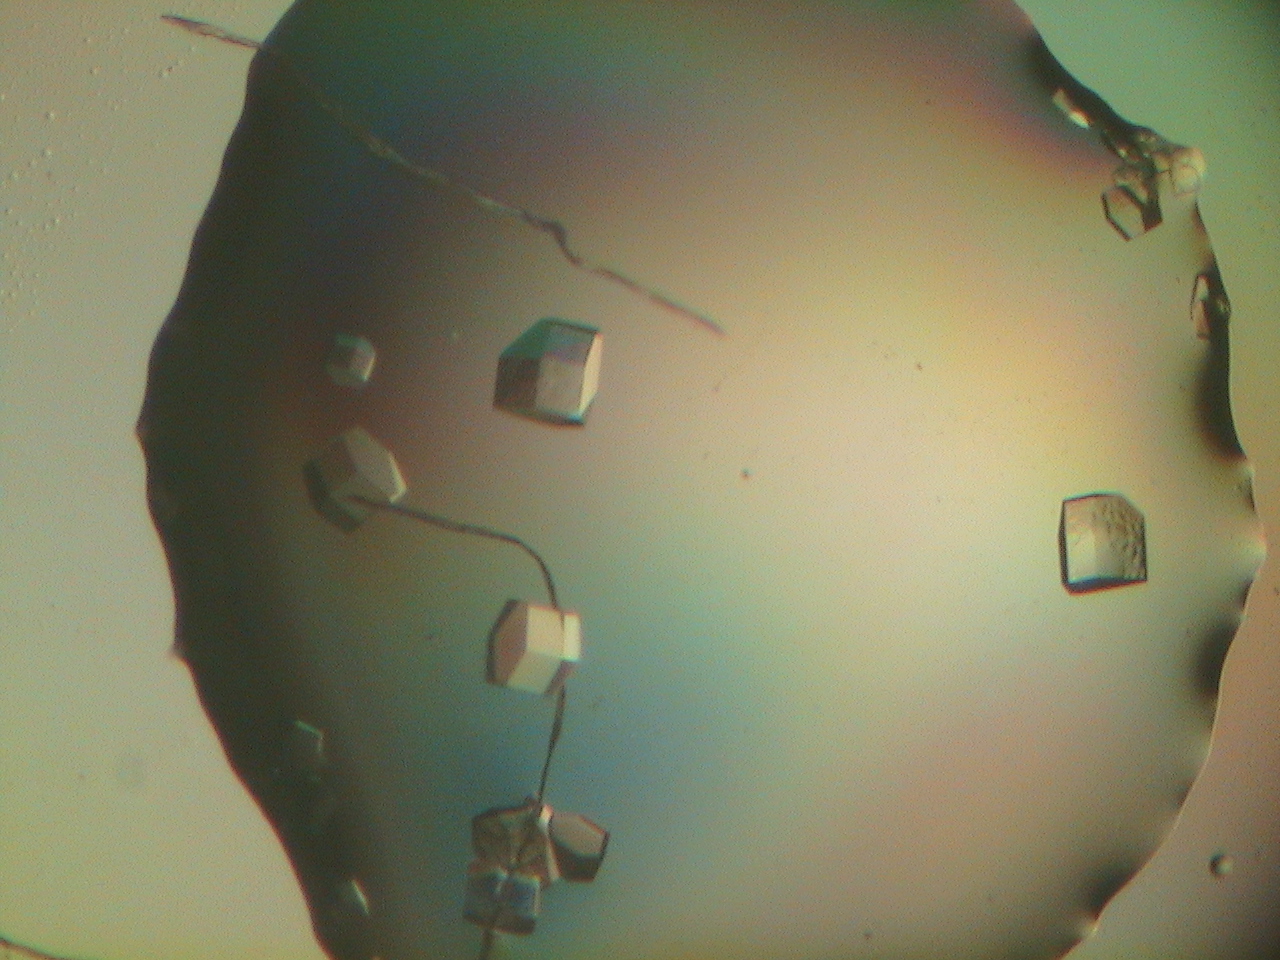
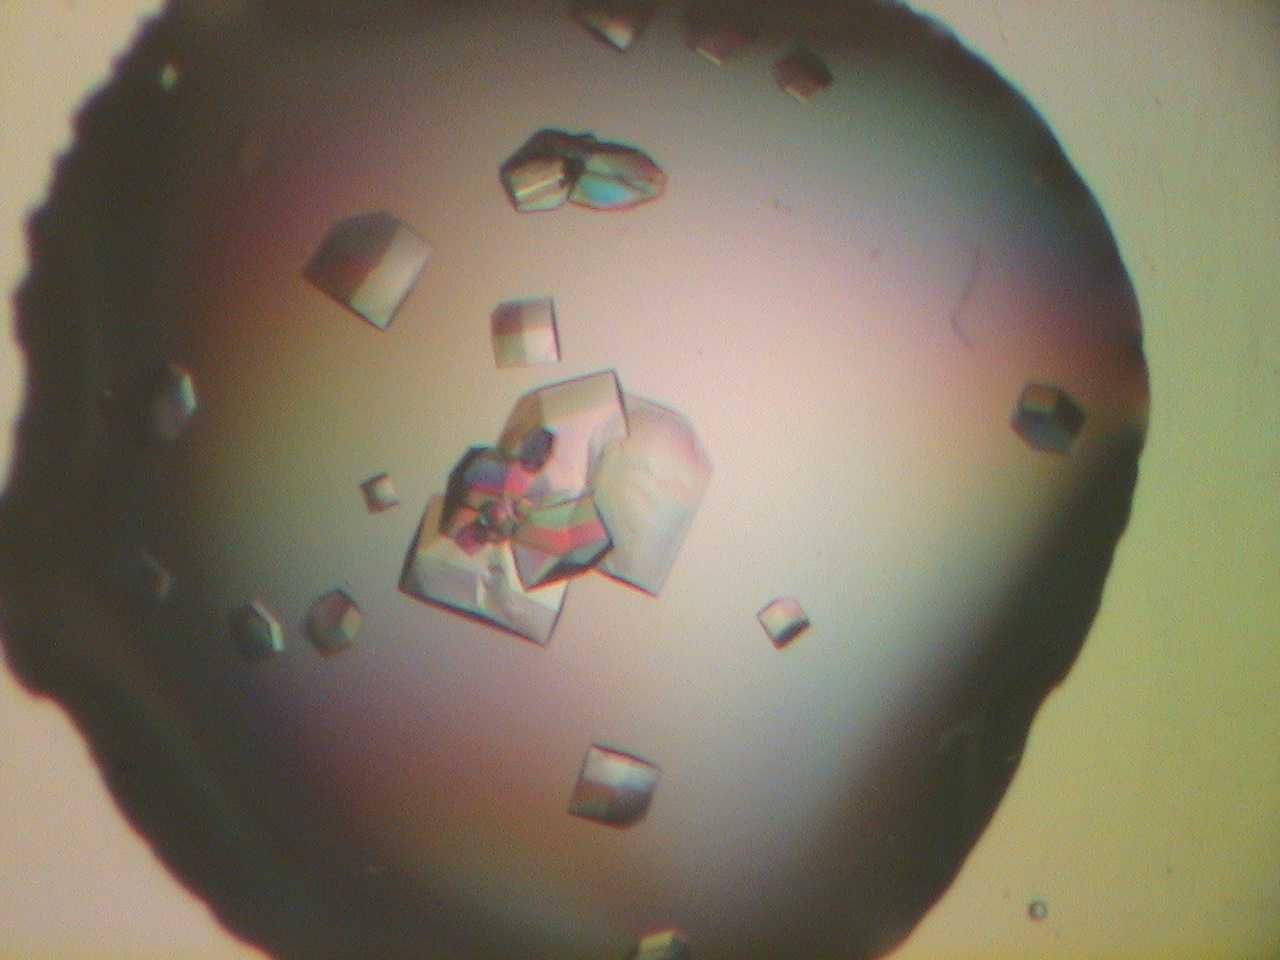
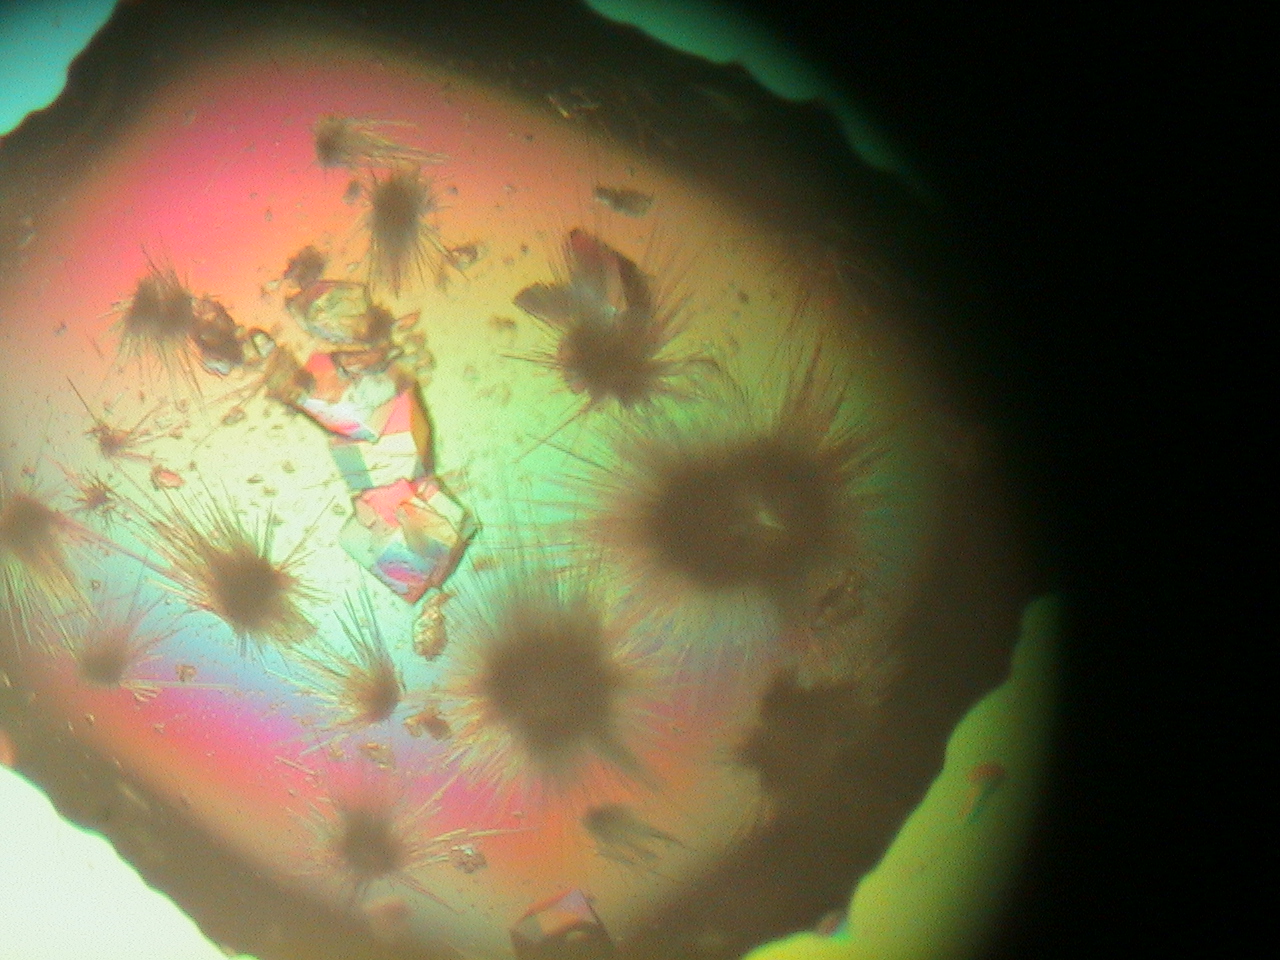
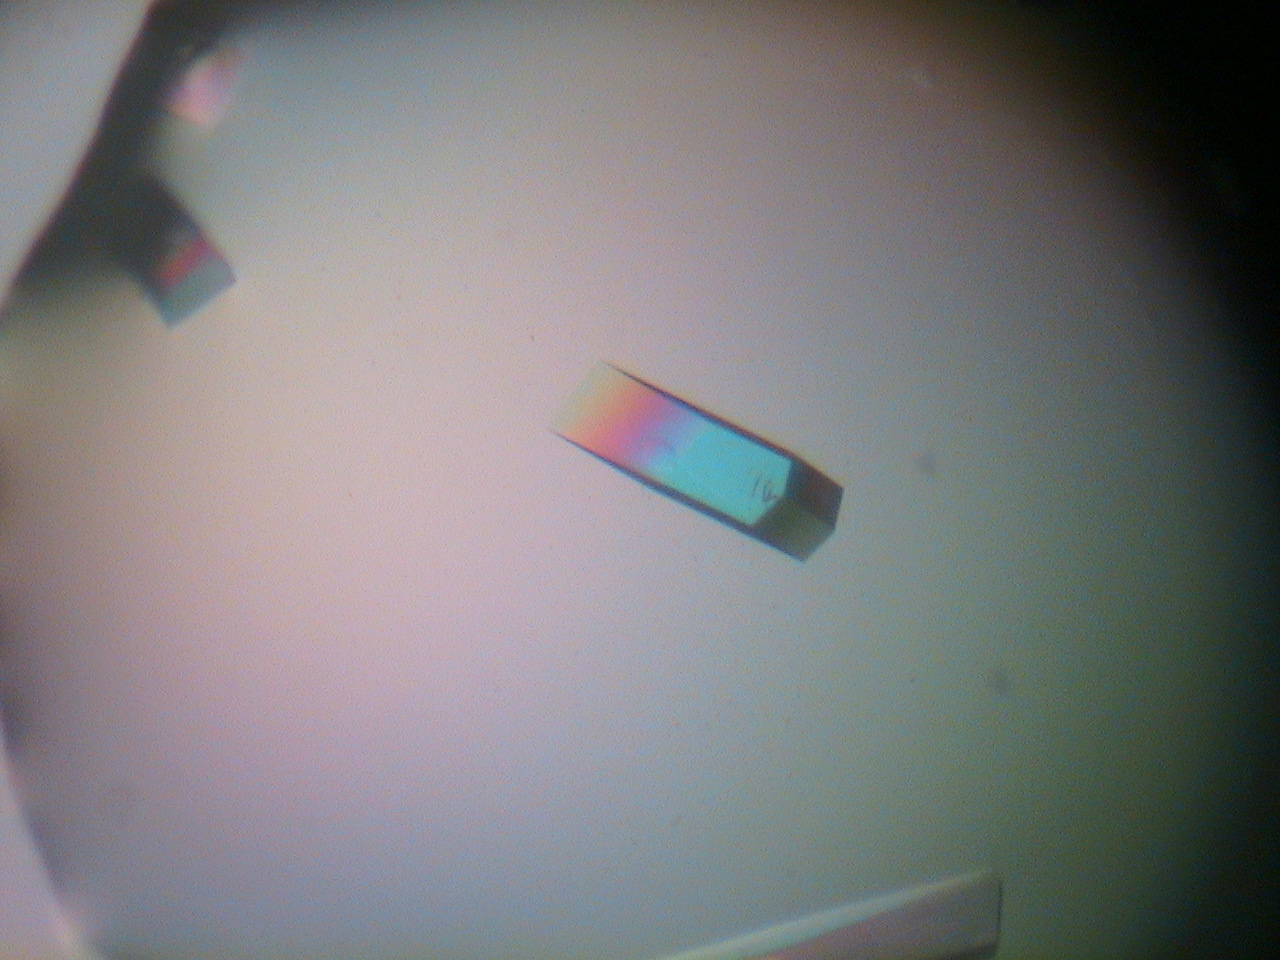
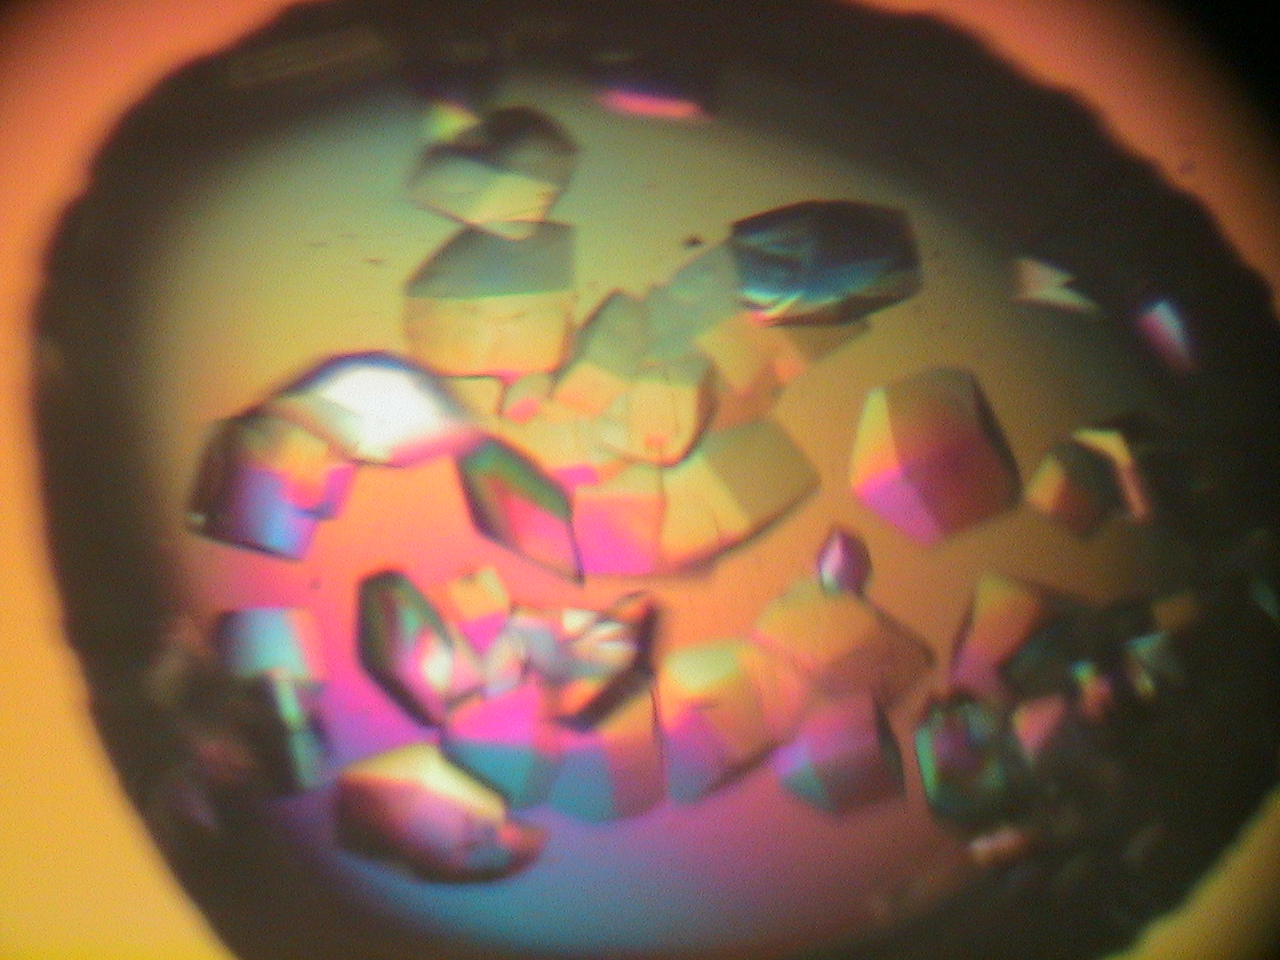
This page presents images of lysozyme crystals grown by students in the Department of Chemistry and Biochemistry at UCSB. Each picture is labeled by group (A1, A2, B1, B2), precipitation solution (X1, X2, Y1, Y2), and the well position. The concentration of protein is typically increasing from 2 mg/mL in the first well to 100 mg/mL in the sixth well. Please contact Dr. Kalju Kahn if you would like to use any of the images.
| ID (MW) | A1 | B1 |
| A1-X1-D B1-X1-E |
|
|
| A1-X2-F B1-X1-No |
|
|
| A1-Y1-F B1-Y1-No |
|
|
| A1-Y2-F B1-Y2-F |
|
|
| ID (MW) | A2 | B2 |
| A2-X1-D B2-X1-D |
 |
 |
| A2-X2-No B1-X2-E |
 |
 |
| A2-Y1-E B1-Y1-E |
 |
 |
| A2-Y2-F B2-Y2-E |
 |
 |