

 Chemistry deals with structures of molecules. Knowing the three-dimensional shapes of molecules allows us to understand a lot about their chemistry. For example, the realization by Jacobus Van't Hoff in 1874 that saturated carbon has four substituents in a tetrahedral arrangement allowed understanding of the molecular basis of chirality. Similarly, realization by James Watson and Francis Crick in 1953 that DNA forms a double helix with complimentary nucleobases interacting via hydrogen bonds allowed understanding of the molecular basis for heredity. Both of these discoveries involved construction and analysis of relevant three-dimensional models.
Biological macromolecules are a lot more complex than typical organic molecules in at least three ways.
 Macromolecules are polymers consisting of a large number of covalently linked monomeric units, called residues. As a result, the number of atoms and covalent bonds in a macromolecule is much larger than in a typical organic molecule. For example, the chromosome 14 in human cells contains 87,410,661 base pairs, and a single polypeptide chain in β-galactosidase is 1023 amino acids long. The figure on the right illustrates the structure of a double helical DNA. This representation shows the atoms as small balls and the covalent bonds as sticks, and is hence called the ball-and-stick model. The ball-and-stick model allows one to see the positions of individual atoms and residues in the polymer (the rungs in the ladder correspond to individual nucleobase pairs). However, ball-and-stick representation becomes too crowded for larger or more spherical molecules. Note how color is used to show two DNA strands that wrap around each other to form a double helix.
 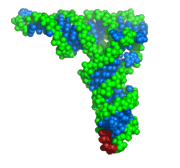 Macromolecules fold into distinct three-dimensional structures. The number of theoretically possible three-dimensional structures that any macromolecule can take is enormous. However, under physiological conditions a macromolecule, such as protein or transfer RNA, adopts a single low-energy conformation called the native conformation. Such macromolecules are active only when they are in their native conformation. The native conformation can change slightly in response to the macromolecule interacting with other molecules. The figure on the right illustrates the native conformation of a transfer RNA molecule. This representation shows the atoms as spheres with radii close to their van der Waals radii. Because the model represents well how atoms fill the space inside and around the molecule, this representation is called the spacefill model. Note how color is used to emphasize the helical secondary structure of the molecule and highlight the three nucleotides that form the anticodon.
 A macromolecule may associate with another similar macromolecule, or with other macromolecules to form even larger supramolecular assemblies that may have properties that their component molecules did not possess. Many proteins function as dimers, trimers, tetramers, or oligomers. Hemoglobin is a protein composed of four polypeptide chains. Each chain contains a heme group and is capable of binding and tightly holding an oxygen molecule. However, only the tetramer of hemoglobin is capable of releasing the bound oxygen in tissues where oxygen is needed. Another example where association is critical for the function is provided by HIV protease, a molecule shown on the right. This representation of HIV protease simplifies the atomic structure of this complex molecule significantly by displaying only the approximate positions of backbone atoms. The secondary structure elements are shown as a cartoon where a helices represent portions of the protein that have alpha-helical secondary structure and arrows are drawn for parts that are individual chains of beta-sheets. Such representation is known as the cartoon model, or the ribbon diagram. Note how color is used to distinguish between different secondary structure elements and also highlights the location of the bound drug.