This page shows 2D gels with IEF on the horizontal dimension and SDS-PAGE on the vertical dimension. Click on the image to donwload a full-size image. Please visit also pages with results from Section 2 results and Section 3 results
To interpret these gels, please see the gel reference page. If you have trouble comparing the two gels, check out this visual guide.
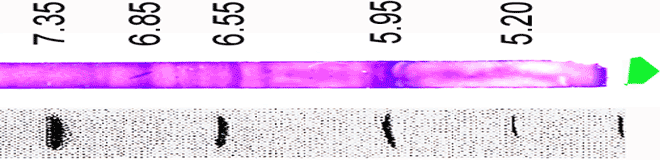
To guide your assignment of pI values, you may use the following isoelectric focussing markers image. The scale of this image corresponds to the large-format image of your SGS-PAGE image. However, because of small variations in the positioning of your IEF strip on the SDS page, it is difficult to tell how these markers align with your gel image. Use these pI values as rough guides, and the reference map above as a more precise way to determine pI values of some of your proteins.
| Section 1: pH 3-10 IEF | Warm Plants | Cold Plants |
|---|---|---|
| A1/A1:ET |
 |
 |
| A2:GH/A1:BA |
 |
 |
| B1/B1 |
 |
 |
| B2/B2: AH |
 |
 |
Thank You for visiting this page.
Return to the Main Page for Chem110L
This document was last updated on Nov 11, 2004.